What the current U.S. market correction means for you
Sound the alarms, this week the S&P 500 has entered correction territory! The purpose of this article is to first of all define what a market correction actually means, what is going on in markets at the moment, review past examples of market corrections and determine what impacts these market phenomena have on investors and how to minimise risk and take advantage of any opportunities.
What is a market correction?
A market correction is characterised as a short and sharp fall in a major stock market index (like the S&P 500, Dow Jones Industrial Average, or FTSE 100), of 10%-20% and typically lasts less than 2 months. A bear market is generally defined as a period of sustained price decline of a major index or other asset class, typically characterised by a drop of 20% or more from a recent peak. This decline is usually measured over a period of at least two months, though the duration and severity can vary significantly.
Putting a label on these things is difficult. There is technically not much difference between a 9% fall and a 10% fall. Or with bear markets, is there really any difference between a 19% or 21% fall from a recent high?
Market corrections happen rather frequently, usually at least every couple of years and are a constant feature of equity market investing. As share prices are driven by earnings and sentiment (in the form of earnings multiples), these pullbacks serve to correct exuberance or reset expectations after a period of rising share prices. Yet, they cause significant rumblings in the financial press and media when they occur. Striking fear into investors caught out and leading to higher trading volume and volatility.
Selling during these periods may indeed save you from enduring a bear market, although more likely, it results in locking in a loss and missing out on an eventual recovery, impacting on longer term returns.
The Current Market Correction
As of the 11th of March , 2025, the S&P 500 officially entered correction territory, defined as a 10% decline from its most recent peak. The index hit a high of 6,144.15 on the 19th of February, 2025, before falling to 5,528.41, marking a 10% drop.
The recent S&P 500 correction has been driven by a combination of trade tensions, economic policy uncertainty, concerns over the AI investment boom, and signs of an economic slowdown.
Politics: President Trump’s decision to impose tariffs on key trading partners and engage in a potentially retaliatory trade war (as he did in 2018) is widely considered to be the trigger of the current volatility. This, along with broader policy unpredictability—such as foreign policy, proposed federal spending cuts and the risk of a government shutdown—has added to market volatility.
Sentiment: Another major factor contributing to the downturn is the AI investment boom, which is now under threat. Over the past two years, the AI sector has been a significant driver of market growth, attracting optimism and substantial investment. However, investors are beginning to question the sustainability of AI-driven stock rallies, drawing comparisons to the dot-com bubble of the late 1990s. The soaring costs of AI infrastructure and the uncertainty around whether the industry can deliver meaningful short-term profits have led to sharp corrections in AI-related stocks. Regardless of the validity of drawing these comparisons, broader market sentiment has weakened, causing significant outflows from tech-heavy indices like the S&P 500 and Nasdaq.
Economic: In addition to these concerns, a slowdown in economic indicators are also playing a role in the market’s decline. Companies are revising revenue projections downward due to higher borrowing costs, reduced business investment, and weaker consumer spending. In the last corporate reporting season, although a good number of companies reported revenue and earnings ahead of high expectations, management teams were reticent to publish bullish guidance given the macroeconomic uncertainty. After two years of solid economic growth whilst pundits were predicting a hard landing or soft landing in the post COVID era, some analysts are now warning that the U.S. economy could enter a mild recession by late 2025, further dampening investor confidence.
Financial Media: As we have progressed from a 24-hour news cycle into a constant streaming news cycle, sensational headlines grab the most attention, and this current market correction seems to be particularly newsworthy due to the coalescence of several jarring factors mentioned above. Due to the strong market performance we have seen over the past couple of years, we need to go back to October 2023 to remember what a correction feels like, so it all seems rather unusual to most, even though market corrections usually occur every other year. The current selloff in the U.S. stock market has raised concerns about whether this is a short-term dip or the start of a more prolonged downturn. The vulnerability of the AI sector, which had been a primary growth engine for the market, has been heavily scrutinised, with many drawing parallels to the dot-com era. Finally, the direct impact of government policies, from trade tariffs to fiscal uncertainty, which drives public interest in the bipolar political commentary age we live in, further stokes fears about economic stability and market anxiety.
Global Story: Elsewhere, markets seem to be holding up relatively well given what has been occurring in the U.S.. European shares have seen a stellar start to the year, as have major Asian bourses. The FTSE 100 hasn’t been immune to the peril given its international exposure, however is only down a fraction of US markets.
History of S&P 500 index corrections
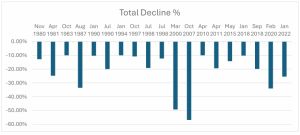
Given that history never repeats but often rhymes, there may be something we can glean from similar scenarios in the past. We have reviewed market corrections of the S&P 500 since 1980 to determine, the size of total market declines in each scenario, the time it takes from breaching the 10% fall threshold to finding the market bottom and, the subsequent returns and probabilities of loss.
As we can see, these events seem to occur almost every other year and range in severity from just touching the 10% threshold, to significant and long running bear markets.
The following chart shows what were to happen to share market investors who either hold on during these periods or indeed buy into these markets. Whilst results vary, investors are paid well for the risk that they take. The median return after 3 months following the crossing of the 10% market correction threshold is 5.21% and when we look 12 months into the future, the median return is 17.85%.
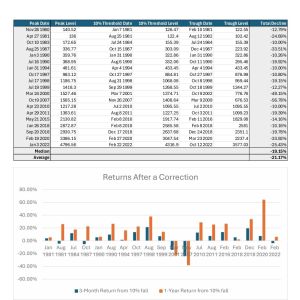
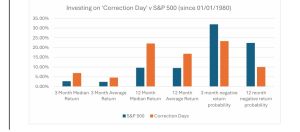
Looking forward from the day the market reaches correction territory we can see that returns over a 3-month and 12-month period are mostly positive. When we look at investing on any random day on the S&P 500 index over the same period, 3-month returns would yield an average return of 2.36%, whilst the average 12-month return is 9.48%, comparing this to investing on correction days, brave investors would receive returns of 4.58% and 16.78% over 3 and 12 months respectively. This indicates that there are potentially higher returns on offer for those who can hold their nerve during these market selloffs.
But does this mean that you need to take on more risk? When we consider the probability of receiving a negative return in the 3 months following the crossing of the 10% market correction threshold, investors have historically lost money 23.33% of the time. Over a longer 12-month period, this improves dramatically to a 10% risk of negative outcomes. When we compare this to investing on any given normal day on the S&P 500 index, the probability of a negative return on any 3-month period is 37.88% or over a 12 month period is 26%.
Market Volatility (CBOE VIX Index)
The CBOE Volatility Index or ‘VIX’ is also known as the ‘fear gauge’. It uses options pricing as a determinant of the market’s expectation of volatility for the next 30 days. The long-term average hovers around a long-term average of around 19, but spikes to higher levels when events cause higher market volatility. The typical chart pattern can be characterised as having long flat periods of low volatility during bull markets when complacency reigns interspersed with sharp spikes as investors rush for put option protection during periods of uncertainty, which generally subsides over very short periods. The index was created in 1993 and backward tested, but the current methodology used to calculate it came into effect in 2003.
CBOE Volatility Index (The VIX)
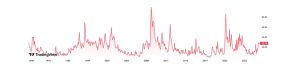
The highest VIX readings occurred during the 2020 COVID-19 Pandemic (82.7) and 2008 Financial Crisis (80.9). Despite high volatility, 12-month returns following VIX spikes were mostly positive. Even during major crises, markets typically recovered within a year. The two instances of negative 12-month returns were after the 9/11 attacks and the Ukraine invasion. Volatility is classified as elevated when the VIX index reaches 27 or higher. On the 10th of March, 2025, the CBOE Volatility Index breached this 27 point mark.
Observations of VIX Spikes above 27 points since 2003
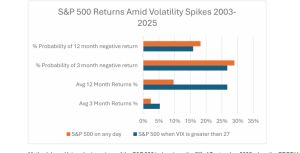
Methodology: Using closing prices of the S&P 500 index since the 2nd of September 2003 when the CBOE Volatility Index methodology changed until the 12th of March 2025. Calculating average 3-month and 12-month returns and probabilities of negative returns following days the VIX reach 27 points or more. Comparing to average 3-month and 12-month returns and probabilities of negative returns of the S&P 500 on days when the VIX index is greater than 27 to all days on the S&P 500.
What does this mean for your portfolio? When markets get spooked, something interesting happens. Average returns for investors are superior to investing in less volatile times over both the following 3-month and 12-month periods. When investing in more volatile conditions, the risk of losing money falls. On average, there is a 13.51% chance that 12-month returns will be negative when investing when the VIX is above 27, but a 19.46% that returns will be negative when investing in the index on any given day.
What’s particularly interesting is how the pattern plays out across different fear levels. When the VIX only reaches the lower end of the panic spectrum (27-30), you might underperform in the short term, but you’ll still likely beat average market returns over the full year. In more extreme outcomes when the VIX spikes above 40, the greater the outperformance over short term and long term, as well as the lower probability of a negative return. The message is clear: when fear spikes, patience pays – and the more extreme the fear, the greater the potential reward.
The Realities of Buying During Market Corrections
Let’s talk about the reality of investing when markets have dropped 10% or more. Yes, we all know we should buy low and sell high, be greedy when others are fearful etc, etc. Being a contrarian investor looks attractive on paper but there’s a reason most people don’t succeed with this approach, and it’s worth understanding why before ploughing in.
First, it’s incredibly unnerving to buy when everyone else is panicking. That 10% drop might feel like catching a falling knife – and sometimes it is. Many of the biggest corrections in history (like 2008 or 2020) blew right past 10% and kept plunging, meaning your “bargain buy” could lose another 20-40% before things improve. Imagine putting in your hard-earned money only to watch it drop by half before recovering. Loss aversion is a primordial instinct that is deeply rooted in the human condition and wading into a sea of red is an unnatural proposition.
Keeping a pile of dry powder for these opportunities also sounds attractive, but while you’re waiting for these correction opportunities with cash on the sidelines, the market might climb 20% or more, leaving you behind. And when a correction finally happens, it’s not as simple as buying “the market” – some sectors that led the drop might stay depressed while others recover and vice versa. The practical side is tough too. You’d need to constantly monitor markets and be tempted into trying to pick the bottom which is unknowable. Plus, these corrections often happen when the economy looks shaky, which might be exactly when your job feels less secure or your business is struggling, meaning your spare capital may not be best served by investing in shares at these times.
It is key to understand that there’s a big difference between looking at historical charts or wisdom from the sages and pulling the trigger when your portfolio is bleeding red, and the news is screaming about market collapse. It’s all about keeping calm, maintaining a long-term view and searching for opportunities amongst the rubble. It doesn’t need to be an ‘all in’ proposition and it certainly isn’t about trying to pick the bottom.
Market Correction Playbook
Everyone wants to have a playbook ready next to their crystal ball to make the most of these opportunities. The reality is there isn’t a pre-determined formula but rather a need for common sense – if you can keep your cool while everyone else is losing theirs.
Pound Cost Averaging – Instead of making one big move when stocks tumble, consider spreading your buying over days or weeks to catch different price points. You’d be surprised how often this beats trying to nail the exact bottom which is a futile exercise in itself.
Quality – The real opportunity in these moments isn’t in chasing the flashy names that everyone’s talking about, but in scooping up rock-solid companies with healthy balance sheets that got unfairly dragged down in the panic. Identify companies with sustainable competitive advantages, consistently growing earnings and low levels of debt. Having a pre-made shopping list of stocks you’ve been eyeing, complete with the prices where you’d pounce, saves you from making snap decisions when emotions are running high. In an event driven market downturn, ask yourself, ‘how will this company’s earnings be negatively impacted?’
Value – Look for sectors experiencing indiscriminate selling where fundamentally sound companies are being punished alongside weaker competitors. This often creates value opportunities when there is a dislocation being company fundamentals and the real value of a company and the fall of the price of its shares. Markets are highly efficient at valuing businesses most of the time, meaning that they are able to price all known information almost instantaneously. But when emotions run hot and human behaviour takes hold, the market, as a collective of humans making decisions, can become irrational.
Double down on high conviction ideas – Using significant corrections to build larger positions in your highest-conviction long-term holdings at more attractive valuations can help you to achieve better long-term outperformance. But make sure you don’t put all your eggs in one basket. Though there is no definitive answer in academia, common sense suggests not allocating any more than 10% of your portfolio to any one investment. The question you need to ask yourself here is ‘what do I do if I’m wrong?’
Tactical Cash Allocation – Keeping some powder dry to invest at lower prices or when fear indicators like the VIX spike has historically paid off handsomely. Down markets tend to arrive swiftly when investor sentiment reaches euphoria, and consensus favours strong economic growth ahead. It’s impossible to determine where we sit in any given cycle and it only ever becomes apparent in hindsight. You don’t want to be sitting on piles of cash as bull markets roar ahead. Bull markets are longer in duration and stronger in direction than bear markets, so holding piles of cash bears a higher risk of opportunity cost. Periodic assessment of sentiment and macro conditions along with regular trimming of profits can help you build cash reserves in up markets, ready to deploy in down markets.
The biggest mistake most investors make isn’t having the wrong strategy when volatility strikes – it’s abandoning their plan altogether when things go awry.
“Everybody has a plan… until they’re punched in the face.” Mike Tyson.
How a Professional Investment Manager Can Help
A professional investment manager adds value during volatile markets by providing critical emotional discipline when panic threatens rational decision-making. They prevent the costly mistakes of panic selling or missing buying opportunities due to fear.
Investment professionals bring practical advantages: ready to deploy investment strategies, institutional-grade research and professional experience to identify genuine value amid selloffs or sophisticated hedging and risk management techniques for downside protection. Their experience implementing dollar-cost averaging during corrections helps optimise entry points across turbulent periods.
Most importantly, a professional manager provides consistency and structure when markets feel chaotic, executing your investment strategy when emotions might otherwise derail your long-term plan.
Middleton Private Capital
With over 40 years’ experience in managing investments for private and institutional clients, we offer a personalised and expert service that represents excellent value.
Our Investment Philosophy: Adaptable. Active. Transparent.
At Middleton Private Capital we believe in a dynamic and adaptable approach to investment management. This differs from most wealth managers and financial advisors who outsource investment decisions and portfolio management to external fund managers.
Adaptable: We are not bound by rigid styles, dogma or tracking a benchmark, but rather embrace flexibility as the cornerstone of our investment philosophy. It also allows us to provide a fully bespoke service that is different from the typical retail service in our industry.
Active: We set out to achieve market-beating returns through proactive portfolio management that adapts to the ever-changing business, economic and sentiment conditions in a manner that is aligned to the needs, preferences and risk tolerance of our clients. We utilise a combination of independent in-house research and leverage external research and expertise as required to completely control the decision process and manage our own investment decisions with a high degree of confidence and capability.
Transparent: We are active portfolio managers, investing in direct shares, bonds, only using funds and derivatives if deemed appropriate. This allows clarity and accountability as our clients know exactly how they are invested, what stocks they hold, line by line profit or loss and why they own them. We are acutely aware that with such control comes responsibility and our future success is linked to your satisfaction. Risk Management is achieved through diversification, an active approach and tactical asset allocation to ensure we are achieving the best possible outcomes in a manner that is aligned to your preferences and risk tolerance.
Who do we Help?
Private Clients – High Net Worth individuals, business owners, retirees, and their families.
Professional Clients – Institutional Investors, Pension Schemes, Independent Financial Advisers, and Accounting & Legal Professionals.
If you are seeking investment advice and or a review of your current portfolio, please get in touch and we will meet with you to see how we can help you.
DISCLAIMER This article is for information purposes only and no part of it or its contents are deemed to be nor should be taken as advice. It does not constitute recommendations to buy or sell any securities mentioned. Past performance of investments is no guide to future returns and you may get back less than you invested. Capital at Risk.
Middleton Private Capital (Head Office)
Cavendish House
Welbeck, Nottinghamshire
S80 3LL
Telephone: 01909 261071
info@middletonprivatecapital.co.uk
Middleton Private Capital (London Office)
8 St James’s Square
London
SW1Y 4JU
London Office: 020 3137 5121
info@middletonprivatecapital.co.uk