Stock Market Cycles

SMC
Where are the stock markets headed next, some tech stocks are soaring while others are struggling.
The big question is where are the markets headed next? It was clear in 2021 that things were getting overheated. It wasn’t just the stock market that was soaring, money was pouring into cars, watches, property and even crazy schemes such as crypto projects and non-fungible tokens.
It was against this back drop that inflation started to pick up. Three things contributed to inflation; further money printing by central banks, direct payments by governments to individuals and businesses, supply chains shutting and the difficulty in restarting them in a disjointed way across the world.
This led to people accumulating excess savings while being confined to their homes and this money was diverted from day-to-day spending, initially to assets and home improvements, then retail and restaurants, followed by travel and leisure. In addition, businesses incurred significant losses and needed to repay government loans, so their prices had to rise. But the final catalyst was an explosion in energy costs following the war in Ukraine.
The response by central banks was to increase interest rates to tame inflation. They were a bit slow to react initially, but we have seen rapid rises in rates from historically low levels to the long-term average of around 5%. The new interest rate environment has been painful for homeowners and businesses that were only able to trade because of cheap financing. This in turn raised the cost of financing for business, as well as reduced economic growth forecasts, causing the markets to fall.
Stocks Bear Market 2022-2024
All of these things were a surprise to me except the drop in stock markets in 2022, as shown below by an extract from my book (The 17.6 Year Stock Market Cycle). There is something about investor psychology that drives investors to bid up markets to extremes during good times and lead to excessive gloom when trouble occurs.
The first stage of the bull market did indeed end in 2022. What has followed is a bear market within the longer-term bull market, quite often these are periods of sideways price action, with a 20%+ drop in the intervening period. The S&P500 fell nearly 28% from peak to trough and that is more than enough for this bear market. I am expecting an autumn swoon, but I think the October 2022 low is the low for this cycle and I anticipate the markets making new highs in 2024.
35 Year Interest Rate Cycle
Whist my main focus is stock market cycles, there are plenty of other cycles that I keep an eye on. One of particular interest at the moment is the interest rate cycle.
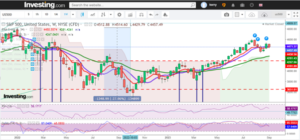
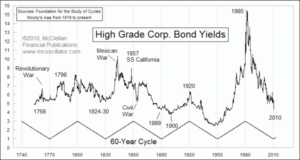
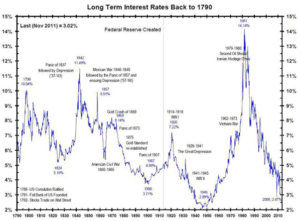
It’s hard to see any obvious pattern but there appears to be long secular trends at play, including a roughly 35 years low to high, high to low cycle.
            Cycle Date    Actual High/Low    Difference
High        1841                      1842                       1 year
Low         1876                     1900                      13 years
High        1911                       1920                      9 years
Low         1946                     1946                           –
High        1981                      1981                            –
Low         2016                     2020                      4 years
Central banks set interest rate policy and can move rates as they see fit, so it’s not surprising that the cycle is a bit hit and miss. What is clear though is the zero interest rate policy environment is well and truly behind us and interest rates are headed up, gradually but also in fits and starts, for the next 35-40 years! This has profound implications for what assets we should invest in, particularly with regard to the bond market. But the stock market trends up over time and we are in a secular stocks bull market until 2035. It is my belief that entrenched inflation post 2035 will lead to double digit interest rates once again in the run up to the end of 2053.
Other Cycle Analysis
I am not the only one who monitors cycles and forecasts a bull market of 10+ years. This chart from RBC Wealth Management is closely aligned to my forecast and shows that US markets could triple from current levels by 2035!
Here’s an old chart showing interest rate cycle, you can see that the forecast low in rates of 2010 is out by 10 years!

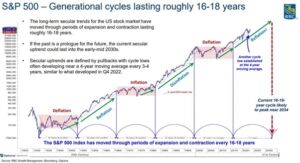
Cycles analysis isn’t as precise as some make out, or as many would like it to be. It provides a roadmap for anticipating future price action, along with other empirical data, but price is always the key piece of information. However, studying cycles forces the mind to consider what events may cause the current trend to stop and reverse. Investors don’t do this enough in my opinion. It is human nature to get carried away at the end of the trend and assume that the current conditions will continue forever, and that we have entered a new paradigm. As the saying goes, history doesn’t repeat, but it often rhymes.

Summary

The next three to six months may cause markets to fall back, but I consider any pullback as the opportunity to put more money to work in the stock markets in order to take advantage of the forecast final blow off leg to the stocks bull market through to 2035.

Privacy Preferences
When you visit our website, it may store information through your browser from specific services, usually in form of cookies. Here you can change your privacy preferences. Please note that blocking some types of cookies may impact your experience on our website and the services we offer.